In this week, our group works on the following aspects:
1. Optimize the code in dividing image, after the reconstruction proecess, the program will not return a black block.
2. Our group created a GUI program to implement the process of the image.
3. Design our poster.
First Part
For the first part, our group tried to divide the large image into very small parts, for example, the 10*10 block or 20*20 block. Our group found some small conslusions on the following:
1. In this project, the process is mainly about matrix calculation. For the 160*160 block, the program needs to generates one matrix, which has the (number of masks)*(the square of block length). The complexcity of the program is O(n^2). n is the length of the small block. When the length of the squrare decreased from 160 to 20, the order of magnitude decreased approximately 1. Then the speed decreased about 2 order of mangnitude. The process speed for one block image increased a lot.
2. Assume the time consumed is t, then t = n*s. In this equation, n is the number of the blocks, the s is the time consumed in processing one block. The s decreased for n is bigger. For example, when the block length decreased from 160 to 20, the n increased about one order of magnitude, but s decreased about 2 order of mangnitude. This shows that the speed will not increase as the the block numbers become more, when n reache one approximately value, the time consumed will becomes the maximum. According to our timer, the time when the block length is equal to 10, the time cosumed is slightly more then when the block length is 20.
For the 2 aspects, our group summarizes the conslusion roughly and illustrate the relationship between the time consumed and the number of blocks for one fixed graph (1920*1200).
For the 2 aspects, our group summarizes the conslusion roughly and illustrate the relationship between the time consumed and the number of blocks for one fixed graph (1920*1200).
 |
| Relationship between Time Consumed and Block Length |
3. Here we defined a parameter r, which is number of masks N over the square of blcok length l. r = N/(l^2). r is in the interval (0,1]. For r approches 1 more, the quality of the reconstruction is better. Which means they have higher similarity.
The conclusion between the rate and the similarity is that if the rate increased, the similarity is higher for there are more masks pattern and ensure the better combine quality.
The conclusion between the rate and the similarity is that if the rate increased, the similarity is higher for there are more masks pattern and ensure the better combine quality.
 |
| Relationship Between NM and Block Size |
Second Part
Our group build a GUI program to illustrate the result. Here are some images:
 |
| 1920*1600 Large Image, Similarity 0.72951 |
 |
| Number of Mask =1, Block Length = 30 |
 |
| Number of Mask = 5, Block Length = 10 |
 |
| Number of Masks = 20, Block Length = 10 |
 |
| Number of Mask = 95, Block Length = 10 |
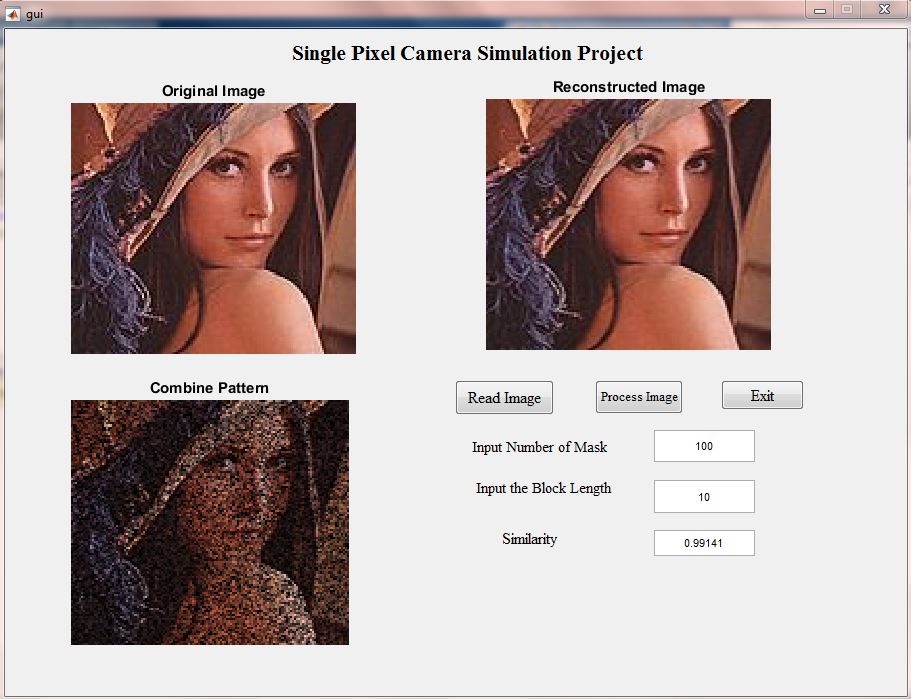 |
| Number of Mask = 100, Block Length =10 |
Third Part
Our poster is on the following:

没有评论:
发表评论